
 QED
QEDTimeline
Arrange scenes into a reading-order graph: routes, branches, and analysis layers over the whole story.
Timeline
Arrange your scenes into a reading-order graph, then read routes, branches, and analysis layers across the whole story.
Authored. You build the canvas by hand. The layers drawn over it are read from analysis, so the graph is yours and the colour on top is the engine's.
The story tree gives you one reading order: top to bottom, folder by folder. That is enough for a novel that runs straight through. It stops being enough the moment your story branches, because a tree cannot show a route that splits at chapter 4 and rejoins at chapter 9.
The Timeline is where that shape becomes visible. You place scenes on a canvas, wire the order they are meant to be read in, and the branches, merges and dead ends show up as a graph you can look at.
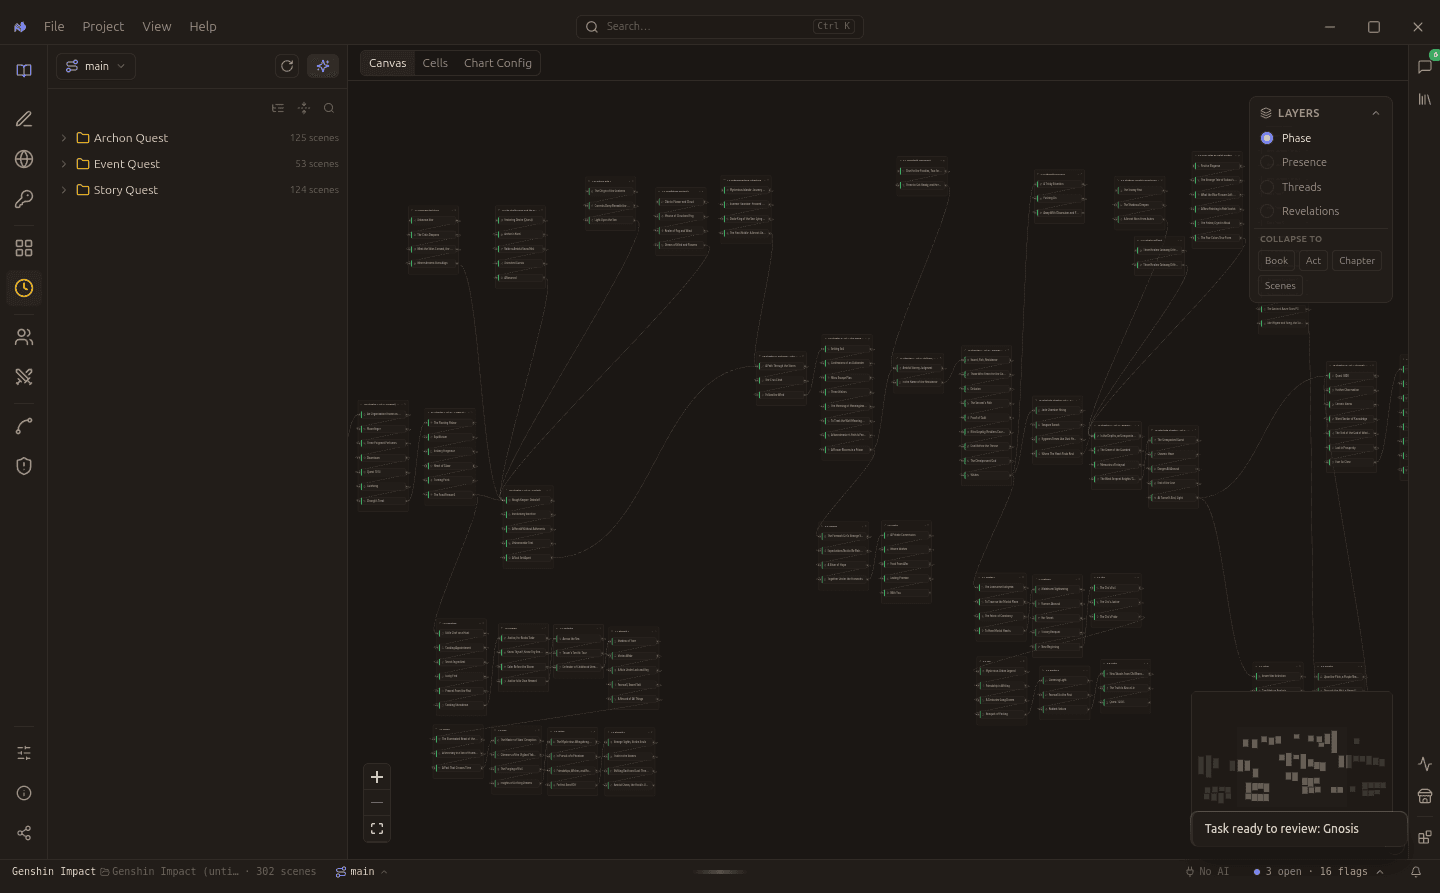
302 scenes across three quest lines. Every card is a real scene and every edge is a leads_to link.
Do you need one?
Most projects do not, at least not at first. Work through this before you spend an afternoon wiring cards.
If you came out at "stay in the story tree", that is a real answer and not a consolation prize. A linear story gains nothing from being redrawn as a straight line.
The three tabs
The sidebar swaps with the tab, so the scene palette and the sequence list never fight for the same space.
| Tab | What it is | Editable |
|---|---|---|
| Canvas | The node graph you build and wire by hand. | Yes |
| Cells | A visual-novel flowchart of the active variant, coloured by route. | No, view only |
| Chart Config | Tunes the linear display that other panels read from. | Yes |
Cells
Same graph, different question. The Canvas is where you arrange; Cells is where you read the shape you made. Every card carries its quest line and version, and routes keep their colour as they split and rejoin, so a branch that quietly runs for twenty scenes before merging back is obvious at a glance.
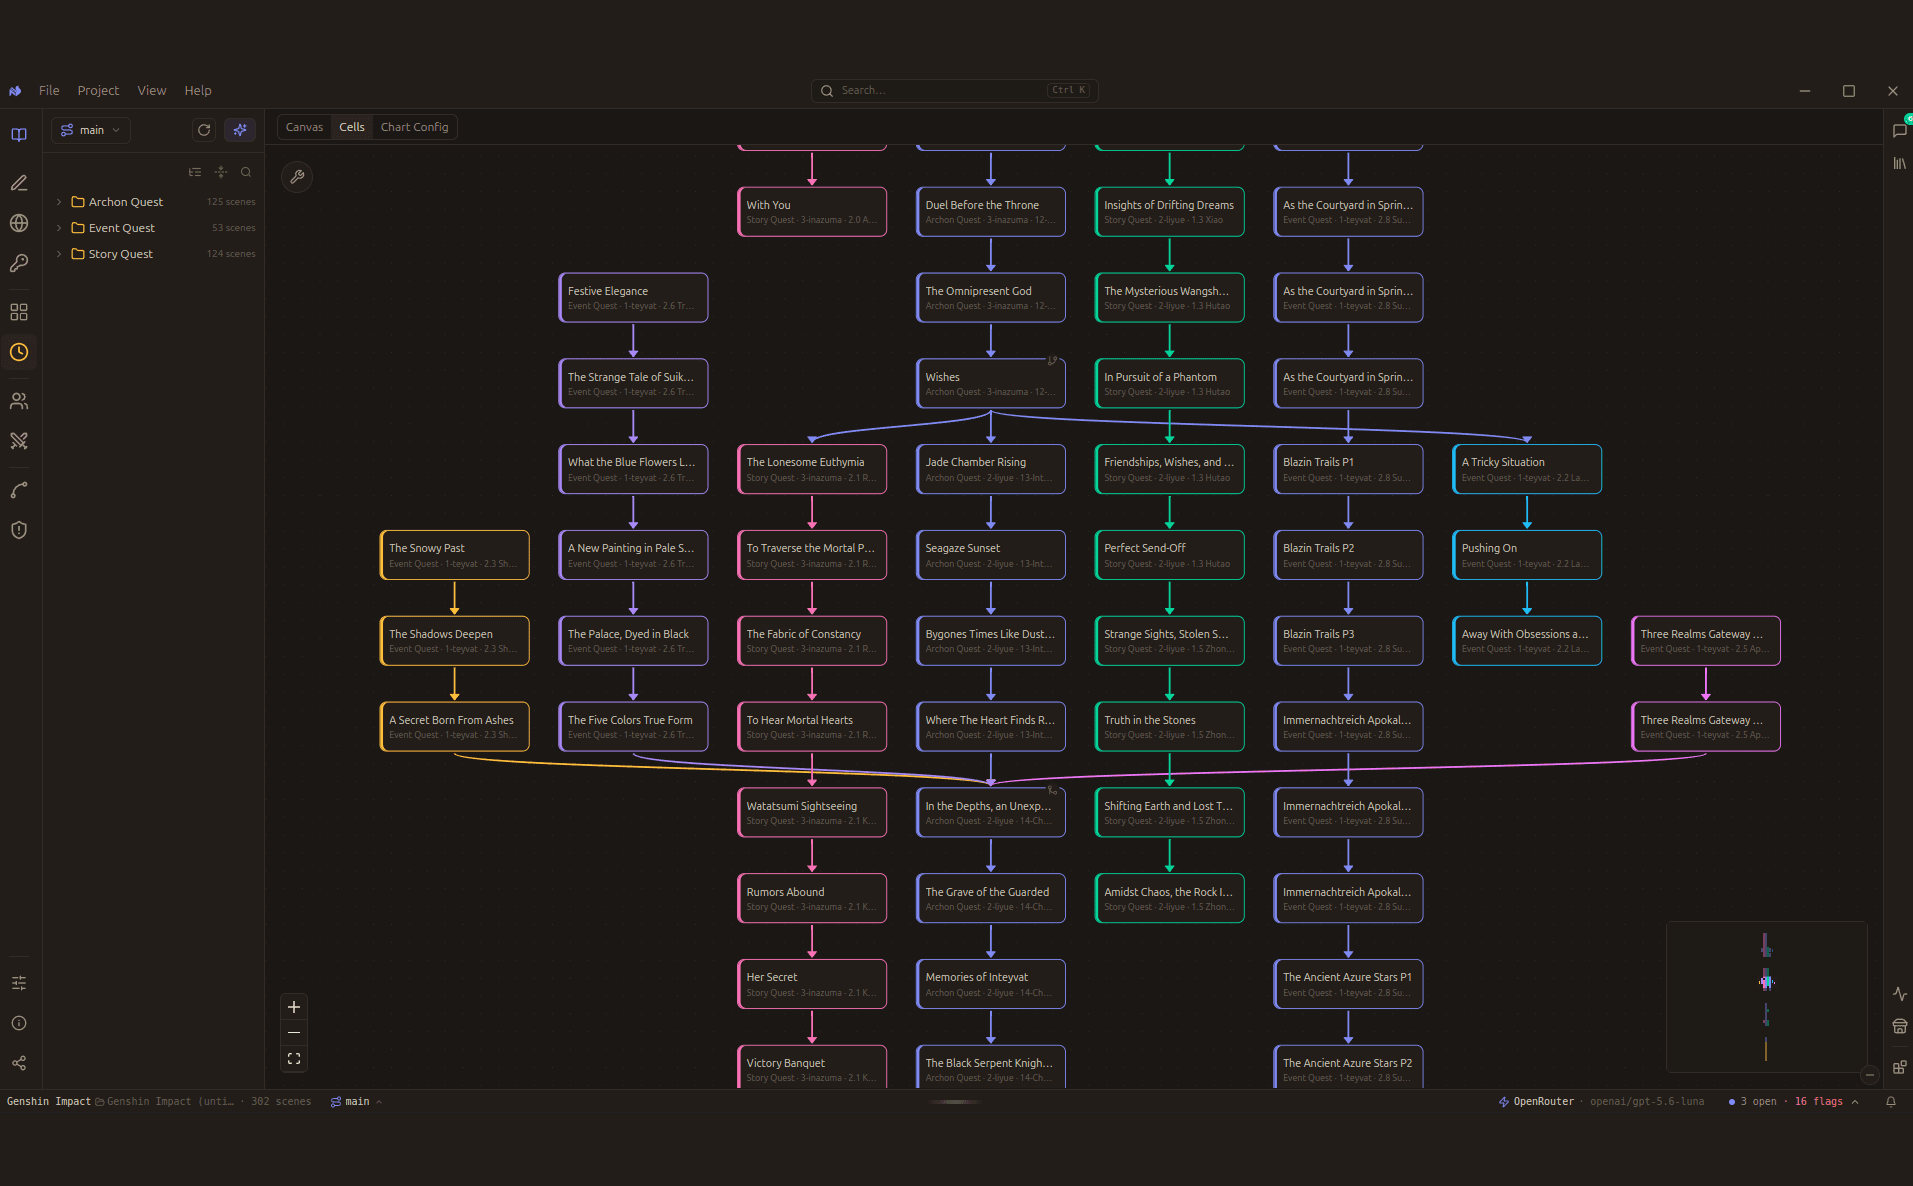
Cells is read-only on purpose. Nothing you do here can disturb the graph you spent an afternoon wiring.
Chart Config
An axis is the running order that other charts chart along. By default it follows the variant's own reading order, which is usually what you want. When it is not, you build a named axis instead.
You build one by lighting a path through the graph: click a scene to light it, double-click to append the whole run after it. The preview above the builder shows exactly what you have selected, column by column.
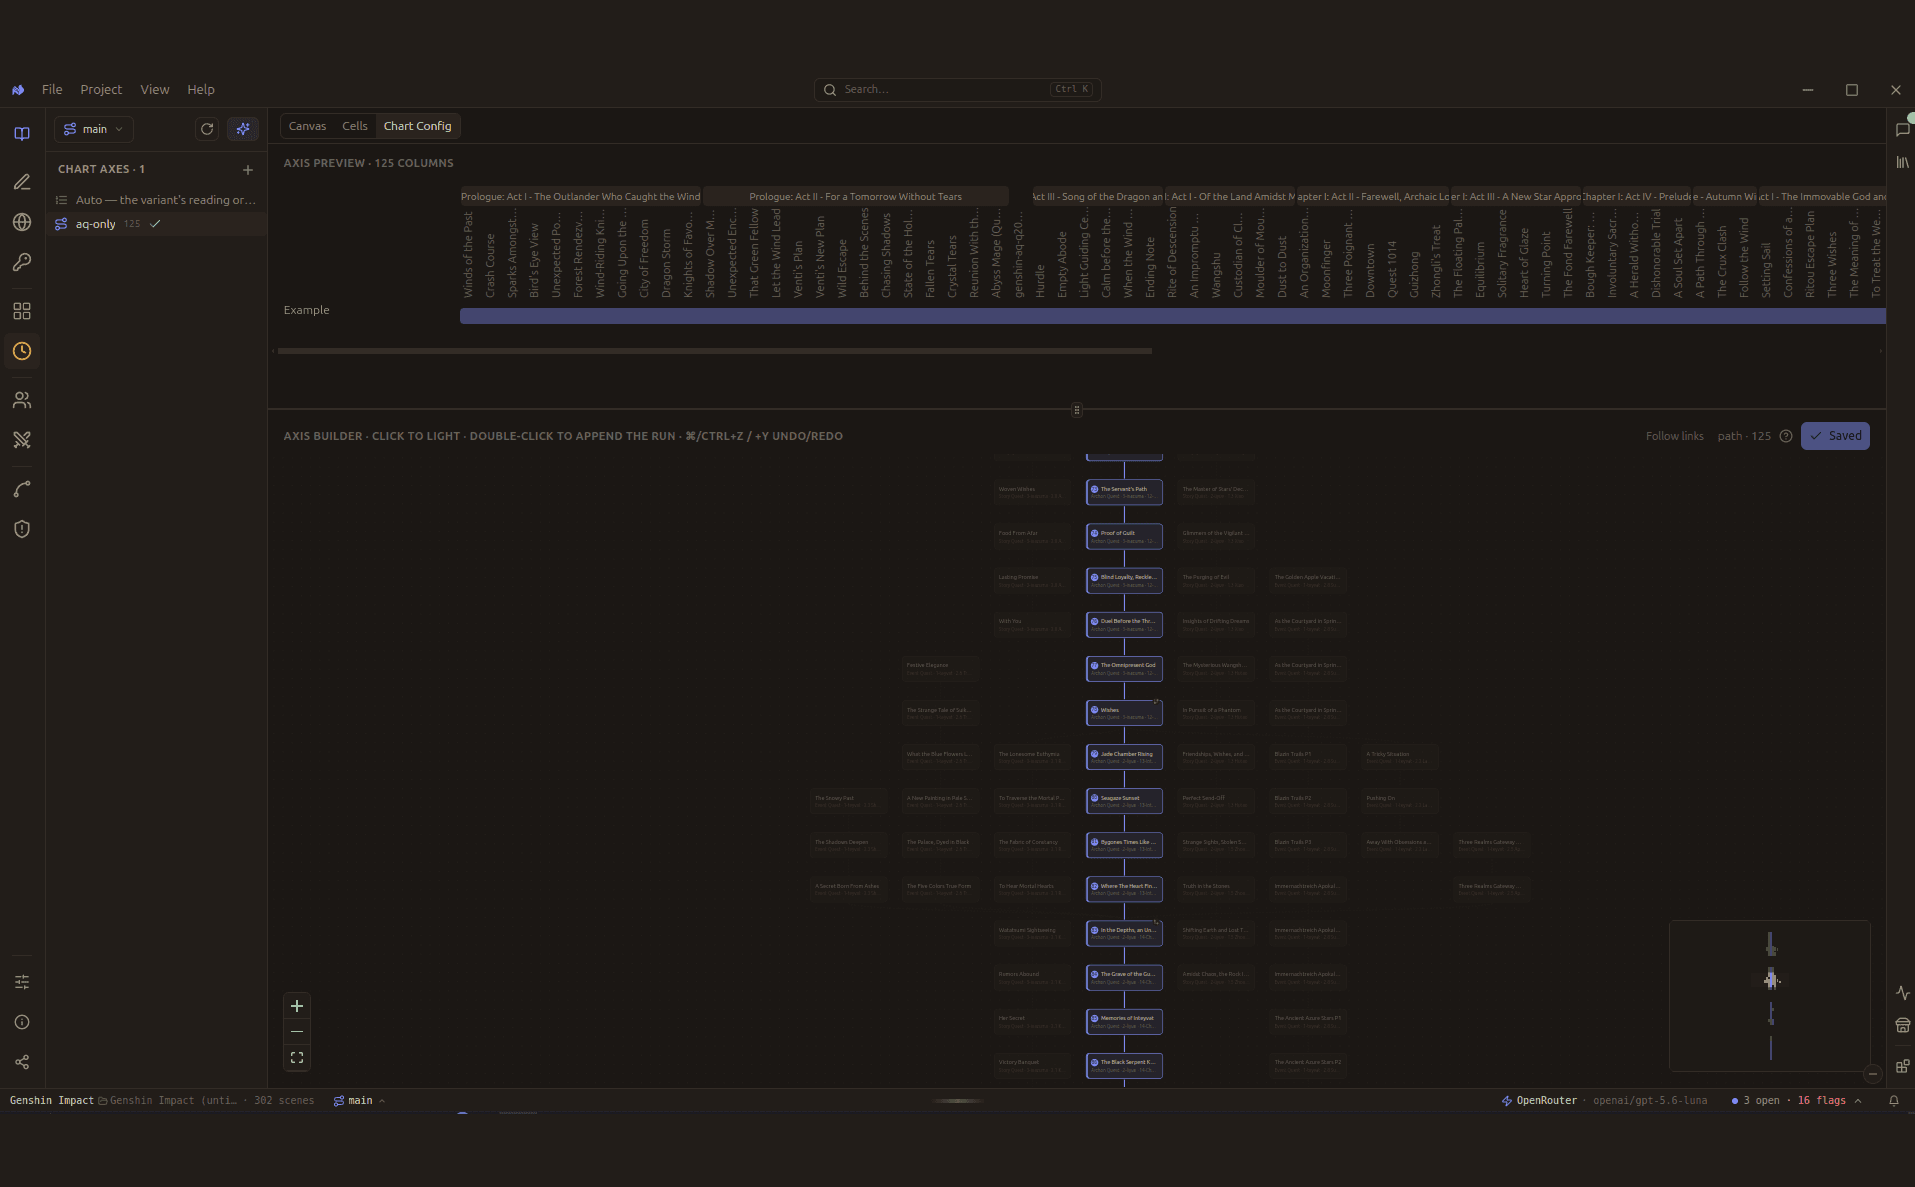
The axis here is aq-only, 125 columns: the Archon Quest line pulled out on its own, so a chart can read the
spine of the story without 177 side-quest scenes diluting it.
Build the canvas
Everything starts by dragging something out of the palette.
| Do this | What happens |
|---|---|
| Drag a scene | It lands as a standalone card |
| Drag a folder | It lands as a group, collapsed. Click the header to expand it |
| Drag a folder card | The whole group moves, and its scenes follow |
| Right dot to left dot | Draws a reading-order link, which writes leads_to |
Select and route
Wiring a long story one edge at a time gets old fast. Select several scenes, then act on all of them at once.
| Key | What it does |
|---|---|
| drag | Draws a selection box. Any scene the box touches is picked up |
| C | Connects the selected scenes in reading order |
| X | Disconnects the selected scenes, cutting every edge into and out of them |
| C | Quick-connect: chains the scenes on the timeline in reading order |
| X | Reset: clears every connector on this variant |
X clears the whole variant, not just what you have selected. It is the one shortcut here worth pausing over.
Edit and delete
| Do this | What happens |
|---|---|
| Click a scene | Opens the read view, cover and prose |
| Backspace or Delete | Removes the selected node or edge |
| A scene inside a folder | Removed through the folder, never on its own |
Layers
A layer repaints the cards you already placed using what the engine read. The graph does not change shape, only what it is telling you.
| Layer | What it draws |
|---|---|
| Phase | Tints each card by its content phase |
| Presence | Cast count per scene |
| Threads | Thread events per scene |
| Revelations | Derived callback and foreshadowing edges, drawn dashed |
Layers are read-only. Turning one on never edits your graph, so it is always safe to flip through all four and see which one answers the question you actually had.